Maps
Over the years, I have made more than a few maps, covering various subject matter. Some are more abstract and artistic, and others are more technical in scope. I have not mentioned sources for the vast majority of these maps, and it has been so long since many of them were made that I do not remember where I got the information from, unfortunately. More recent maps will include source attributions in the descriptions next to them.
The Sunrise Trail Through Tidnish, Lorneville, Amherst Shore, and Northport (2024)
An older-style map of the shore road between Tidnish and Lorneville, with roads, highways, and places of interest. As seen in multiple Facebook posts — thank you to everyone who gave me feedback!

Waterways of New Brunswick (2023)
This is a continuation of the maps series for the Miramichi and Restigouche watersheds — extended this time to cover all of New Brunswick and some surrounding areas. Again I used the CanTopo maps, and the USGS Map Viewer for information in Maine. Names for provinces/states and bodies of water are in Wolastoqey and Mi’kmaw. The original inspiration for this series is Daniel Huffman’s work. Thank you to everyone who advised me for the finer points of this map. If it appears too small here, I would be happy to provide a more detailed copy. This map (and other subway maps) were featured in this CBC article.

Beaubassin (2023)
This is my own stylized version of a map that can be found on a plaque in Fort Lawrence, NS, detailing the various Acadian settlements that were once found in the Beaubassin region. I did this one in the style of Champlain’s map of New France, because it seemed to fit.

Tami Mi’kmawi’sultimk Mi’kma’kik? | Where is Mi’kmaw Spoken in Mi’kma’ki? (2023)
This map is a StatCan data visualization for where there were people who reported ‘knowledge’ of the Mi’kmaw language. It is entirely in Mi’kmaw, and it hasn’t been looked over by a native speaker, and so should be taken with so many grains of salt.

Northport, NS (2023)
This map is created using OpenStreetMap through the publicly available ODbL. Hopefully I’ve credited that properly. Credit should also be given to Iron Echo Design for the inspiration behind the watercolour styling for this map.

Salmo salar subway lines of the Restigouche Watershed (2023)
Back by popular demand, this map is the same style as the previous one of the Miramichi Watershed below. I’ll again link Daniel Huffman’s work and the CanTopo maps. Thanks again to Dr. Josh Kurek for sharing on Twitter!

Salmo Salar subway lines of the Miramichi Watershed (2023)
This map depicts the tributaries of the Miramichi and other rivers that flow into Miramichi Bay in a transit map style (see New York’s subway map or London’s tube map, for example). I made this map to help me learn, when people talk about such-and-such river, where that actually is, and where it leads to. I really thought I was being clever with this transit map interpretation of a watershed, but it has indeed been done before. See Daniel Huffman's work from which I took inspiration. It’s no wonder it’s been done before, because it works so nicely. Many thanks to Dr. Josh Kurek for sharing this map on Twitter. The geographical information for this map is taken from the CanTopo series of publicly available maps from NRCAN.

The Almoravid Dynasty (2021)
This map is in a more artistic style, with traces of major buildings in the Almoravid style, and depicts the extent of the Almoravid Dynasty of Morocco at around 1120 CE.

The Arctic Archipelago (2022)
This map depicts the maximum sea ice extent in September 2021, with illustrations of various arctic fauna.

Ecoregions of Australia (2021)
This is a simple map depicting the ecoregions of Australia, as defined by the WWF. The original plan was to include sketches of characteristic fauna, but I didn’t end up liking it.

“Egg” in Various Extant Indigenous Languages of North America (2022)
This was a product of many hours of research, trying to collate the words for ‘egg’ in as many living Indigenous languages of North America as possible. I found some limitations in space in Mesoamerica, so it might not be as accurate in there as I would have liked. Probably should have done an inset. Some of the text is quite small, so the image might have to be opened separately.

Frisia in the Frisian Freedom (2022)
This map depicts the various holdings in the region of Frisia, adjacent the North Sea in Europe. If I recall correctly, most of the information here is taken right from Wikipedia. Toponyms are localized to whatever language is currently most spoken in that area. Indeed, the title of the map is in Frisian.

Hydronymy of the Madawaska Valley (2022)
This map depicts the various rivers, streams, and lakes that are found in the Upper Madawaska Valley, in this case between the communities of Madawaska and Palmer Rapids. This is a reworking of an NRCAN topographic map of the same area.

French in the Maritimes (2020)
This is a very simple visualization of StatCan data, depicting ‘knowledge’ (i.e. fluency) of French by each county in the Maritime provinces. The scale at the top has a small error in the numbers, but I hope it can be inferred that each colour is a bin capturing 10% increases in knowledge of French.

Watersheds of New Brunswick (2022)
This is a reworking of UNBI’s many watershed maps that can be found on their website. There are however, gaps in hydronyms, so those could not be transferred onto this map.

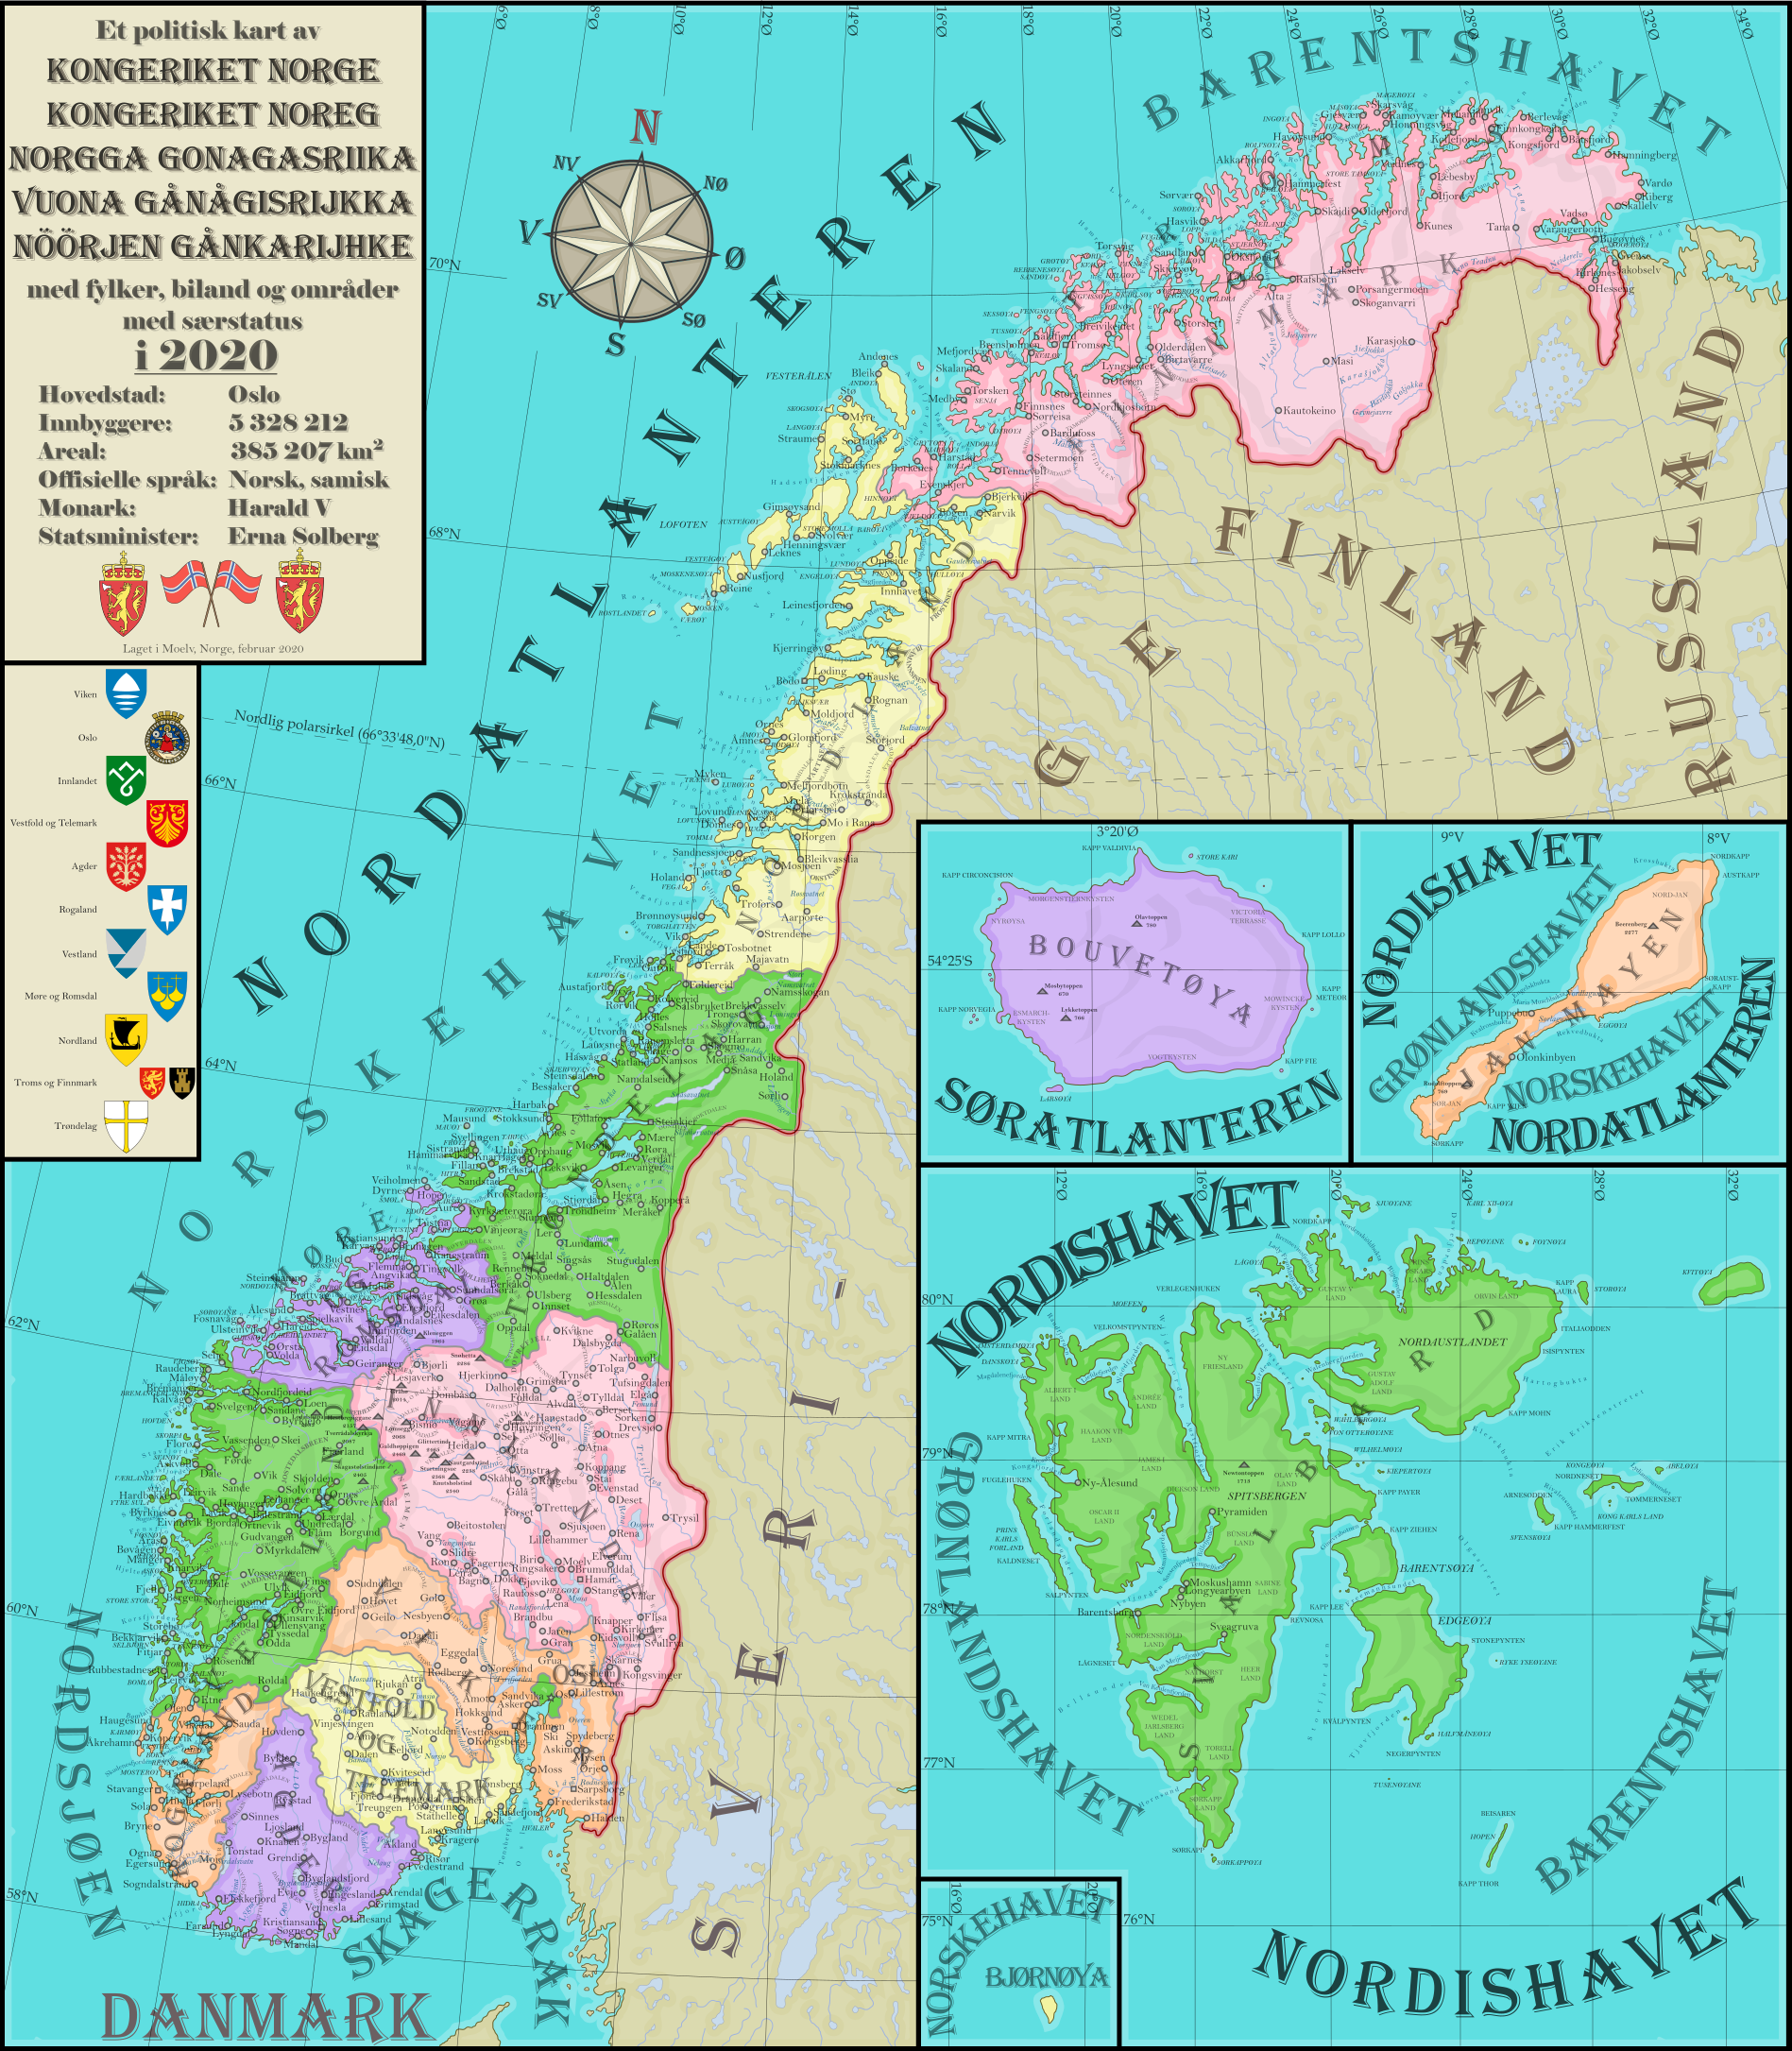
Political Divisions of Norway (2020)
This map was made while I was living in Norway, and helped me better understand the geography of the country. It was made just after the amalgamation of several counties and municipalities to create new ones. As of 2022, Viken is in the process of being re-dissolved, back into the previous counties of Buskerud, Akershus, and Østfold. Again, some of the text can be quite small, so the image may have to be opened separately.
Cumberland & Westmorland Counties (2021)
This map was made when I first moved down east for university in the summer of 2021, and for the same reason as the map of Norway – to better understand the local geography.

Indigenous Languages of Ontario: Present & Past (2020)
This map compares the present and past distributions of Indigenous languages in Ontario, and how those languages are related to each other. Some of the names are tentative.

Indigenous Languages in Quebec (2020)
This map examines the most commonly spoken Indigenous language in Quebec and Labrador, by economic region (Quebec) and census division (Labrador). This is another visualization of StatCan data. This is another one where the text is small, and a little blurry – I lost the .svg original for this map in April 2021, so this is the highest resolution available. It has been rightly pointed out to me that it is fairly colonial to show the most spoken Indigenous language in an area using the census boundaries, which are colonial in origin, and I did put some thought into this topic. The visualization of StatCan data through a map like this necessarily relies on the census boundaries, and it is incredibly difficult to reconcile those census boundaries with other demarcations that are Indigenous in origin — the census data is just not enumerated that way, which I would say is instead a problem of the system itself. In any case, this is just that, a visualization of StatCan data, unlike the map of Ontario, which takes into consideration pre-contact distribution as well. This can be seen here in and around Montreal, where the most commonly spoken Indigenous language is Inuktitut, and this would likely not be shown in this way if I had taken traditional territories and pre-contact distributions into account.

Endemic Wildflowers of Tasmania (2022)
Barely a map, this is more a poster, showing a few species of wildflower endemic to the island of Tasmania. The flowers are illustrated around the outside, with a simple map of Tasmania in the centre.

A Road Map of Sackville (2022)
This was a map I made to show the connections of all the roads in Sackville, from how I tend to visualize them – with east facing up. This was made using Google Maps data from 2021.

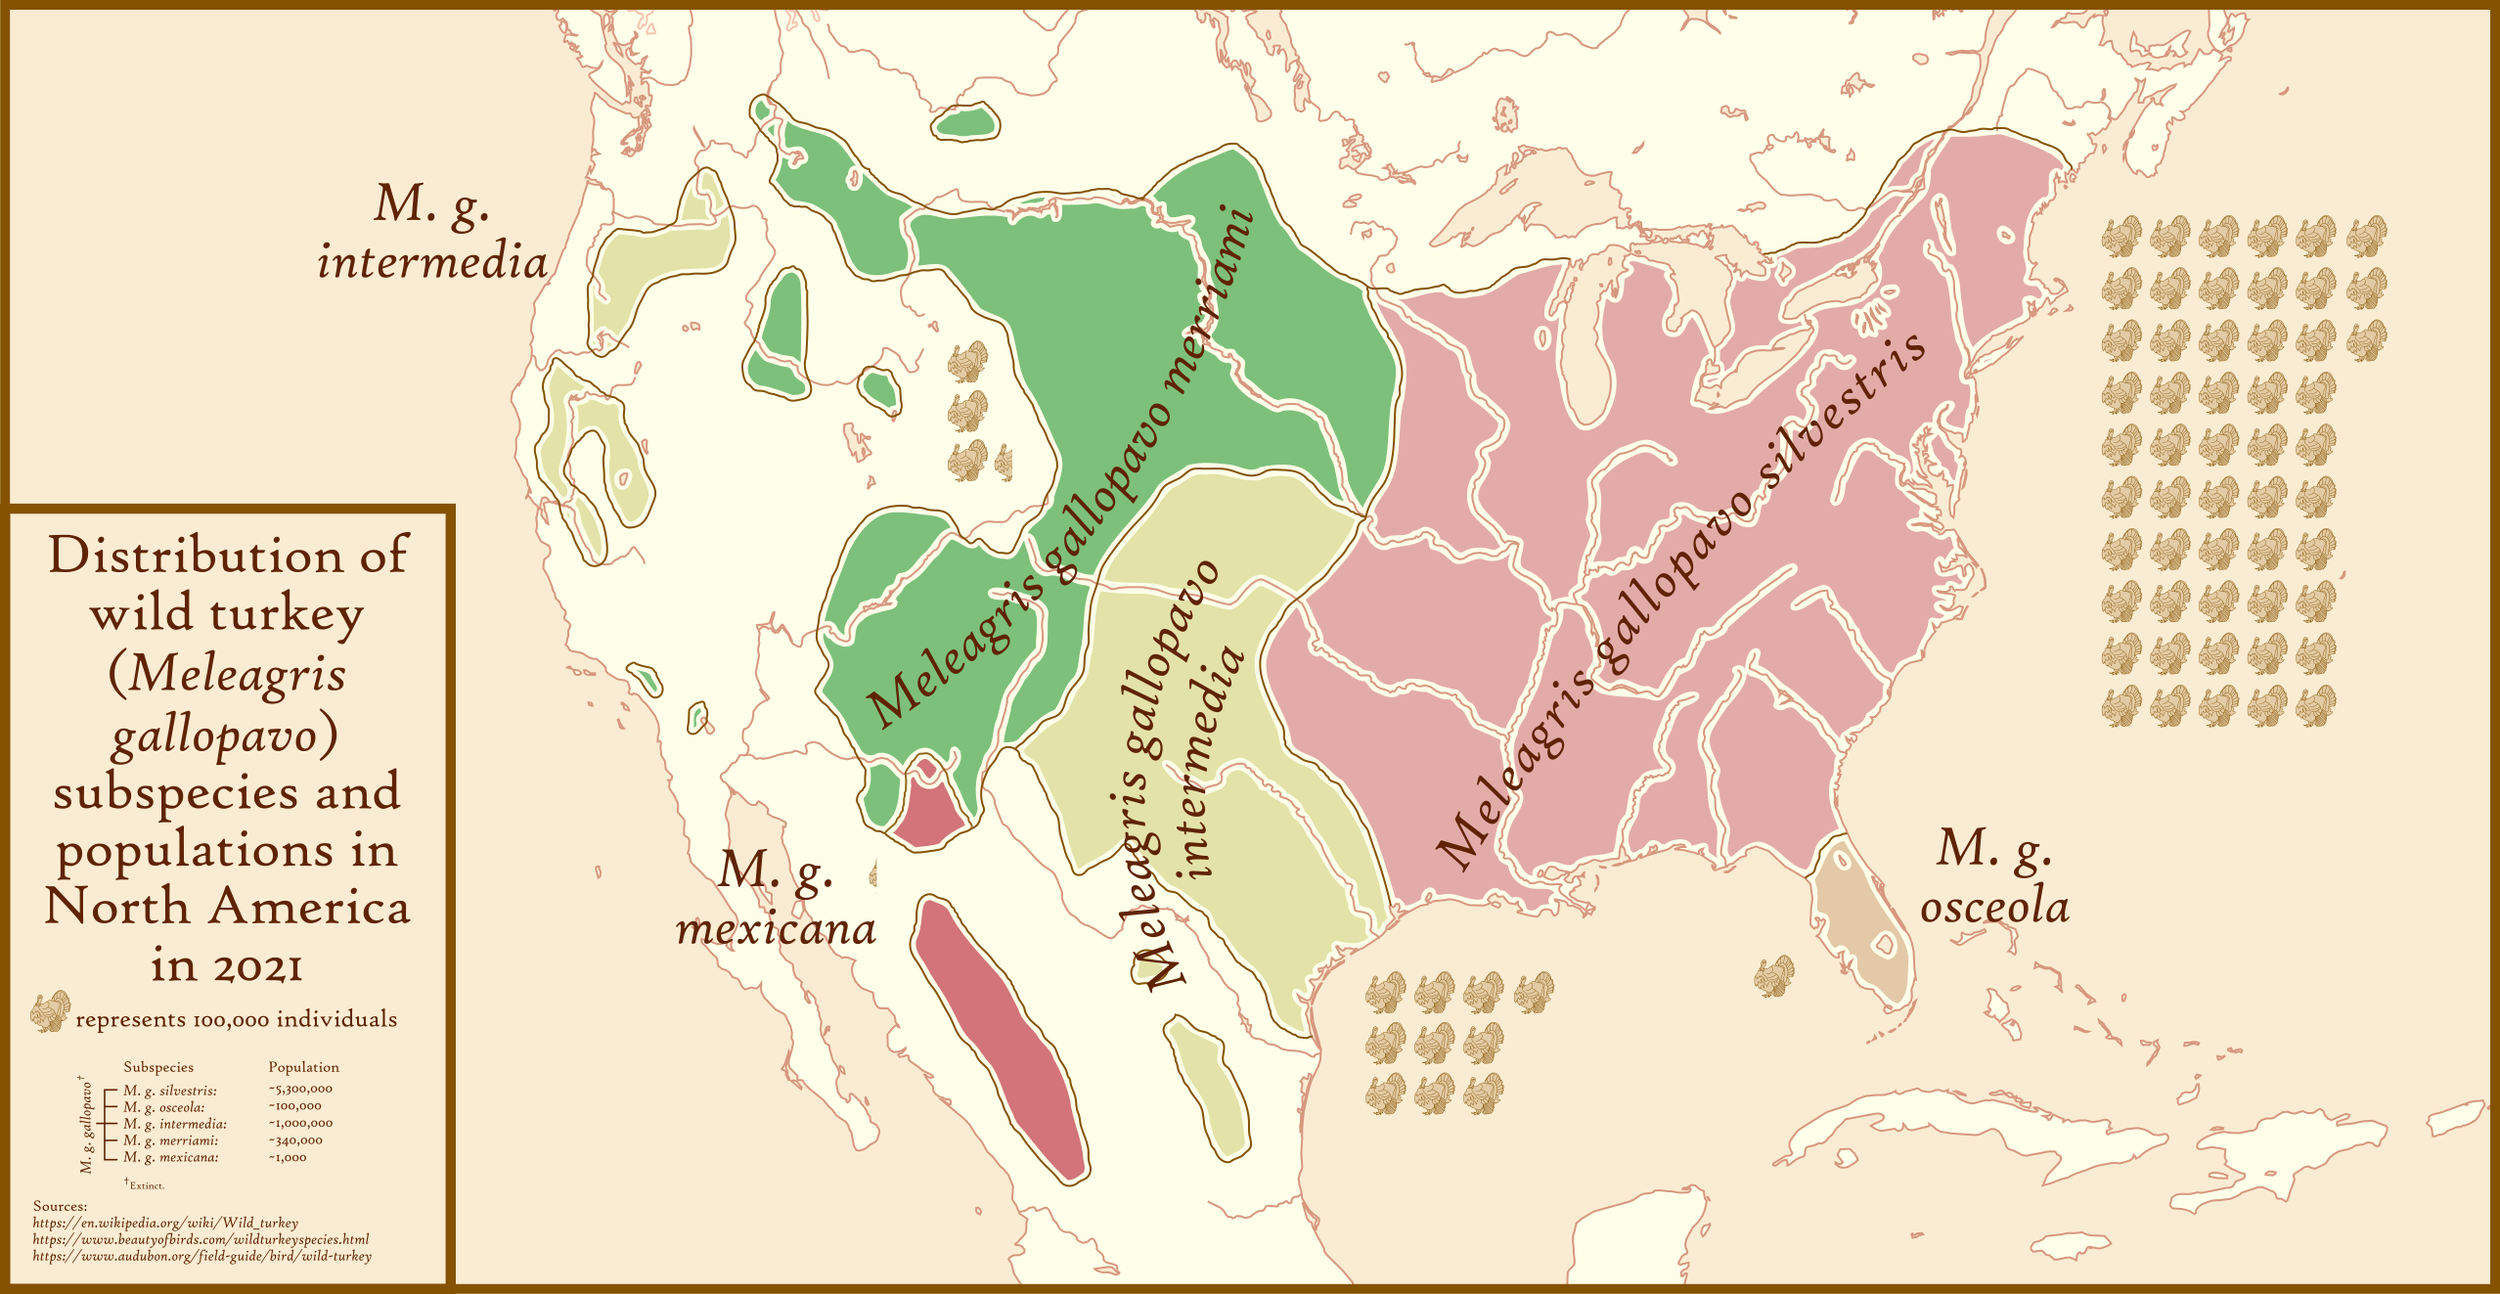
Subspecies of Turkey (2021)
For Thanksgiving 2021, I made this map, showing the distribution and population sizes of different subspecies of turkey in North America (the original native subspecies of which is now extinct).
Dialects of Norway (2021)
This is again another poster, but it contains a few maps. The intent was to show a brief summary of Norwegian dialects, which are very diverse, and some key differences between them. This is another where the text is very small and you may have to open the image separately
